In this field report
A lab dashboard can look healthy while telling its operator very little. A machine marked always-on can still have an unreachable service. A temperature can be valid when collected but misleading later. Two operating-system records can describe one physical workstation rather than two machines.
Fleet Command's September 14 repair started with those distinctions. We did not add a new inference workload or restart the lab's model hosts. We repaired the private panel's identity, collection and presentation contracts, then restarted only its own backend.
One physical machine, several records
The old registry used inconsistent labels and stale assignments. Olympus retained an older alias, Talos appeared under another name, and Koba's Linux identity also appeared as Kong. Hardware fields for some machines were no longer defensible as current observations.
The repair normalized aliases while preserving provenance. It did not treat an old registry entry as a newly measured GPU assignment. Unresolved fields became unverified rather than being replaced with plausible specifications.
The resulting registry contained 17 configured entries. That is a configuration count, not certification that 17 machines were powered on, enrolled in monitoring or fully inventoried. A complete physical census remains separate work.
This matters when a command targets a machine. A convenient alias is acceptable only when it resolves to the intended physical host. Operating-system-specific records should retain their meaning without becoming phantom extra workstations.
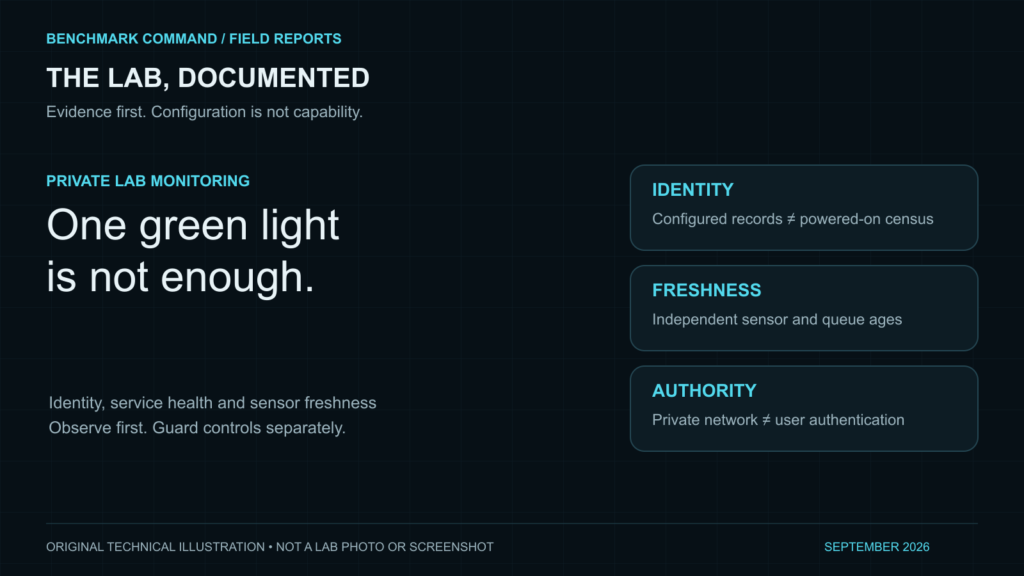
Replace one green light with distinct signals
We separated several questions that the old interface had compressed into online status:
- Is there evidence of a reachable host or endpoint?
- Is the declared service port open?
- Does the application API answer correctly?
- How recently did a sensor provide a valid measurement?
- Is there genuinely active application work?
A declared port is configuration, not proof that a service answers. A model-list response is an inventory observation, not a successful inference. A down monitoring record can mean unavailable monitoring, not necessarily a powered-off computer.
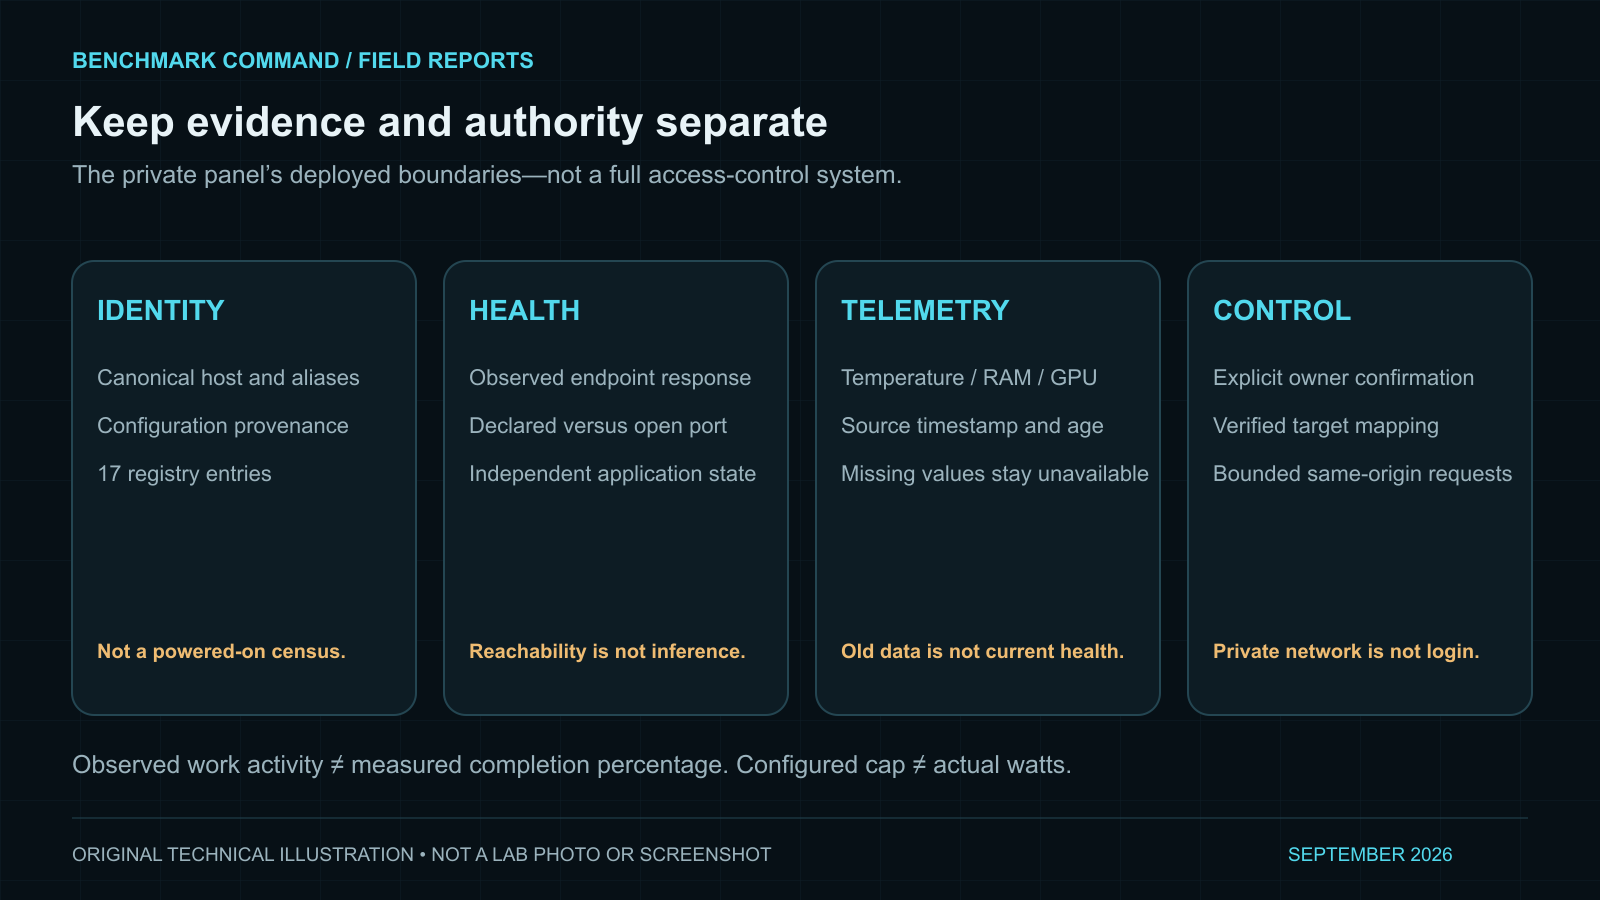
The diagram describes the implemented signal boundaries. It is not a screenshot or a complete security architecture.
The green activity indicator also needed an honest label. It represents an active application queue, not a measured percentage of completed work. Without a trustworthy completion signal, a moving bar should not masquerade as a progress estimate.
Sensors already existed
One of the practical findings was that the machines already emitted useful hardware readings. The panel had not subscribed to the available passive stream.
The repaired collector used bounded reads, selected only supported CPU/RAM/GPU fields and attached timestamps. Sensor freshness and application-queue freshness were evaluated separately. Missing temperatures stayed unavailable instead of becoming zero degrees or inheriting a reading from another host.
The design used a 20-second server cache, a 30-second panel polling interval and a 120-second telemetry staleness threshold. Future timestamps outside the accepted tolerance were rejected. These are the deployed defaults, not universal monitoring recommendations.
A retained post-deployment snapshot showed fresh temperature and memory readings from three hosts. That establishes collection at the recorded time. It does not establish continuous coverage, accurate electrical power measurement or a particular application's output quality.
A dashboard should not create work by accident
The repaired backend does not submit generation jobs, start benchmarks, clear queues or restart model services. Observation remains separate from operation.
Wake controls are restricted to identities whose mapping was verified. The browser asks for explicit confirmation, the backend checks the canonical target and the request must meet the management-source and same-origin requirements. No actual wake packets were sent during this repair's regression testing.
Data displayed in the panel is treated as text rather than inserted as executable markup. Browser API calls are same-origin instead of relying on hardcoded machine addresses in page scripts. The collector has fixed target constraints and bounded response sizes; it does not follow arbitrary redirects or environment proxy settings into unrelated destinations.
These restrictions reduce the panel's exposure. They are not login authentication. The current system is a private operator panel, not a ready-to-share public or guest management portal.
What we verified
The retained regression suite passed 19 backend tests and 13 browser-code tests. The backend tests mocked network and packet operations. The browser tests used a mocked DOM, clock, fetch and confirmation flow.
The suite exercised source/Host restrictions, cross-origin rejection, explicit wake confirmation, invalid targets, stale and future timestamps, queue freshness and safe text rendering. It sent no real wake packets, inference requests or production control actions.
The deployment also verified source hashes, retained a private backup and checked that the specific backend service returned healthy with a different process ID. Only that service restarted. Existing model and application services were untouched.
Mocked browser tests are not a real mobile visual review. The supported browser helper failed, so that check remained unperformed. A passing test count must not erase the distinction between code-level coverage and a human using the actual interface.
The next operating layer
The next useful work is enrollment and alerting, not more decorative status widgets. Sentinel still needs defensible monitoring enrollment. Intel temperature and power must remain unavailable until a source can actually provide them.
Notifications should distinguish successful task execution from confirmed message delivery. Alerts need persistence and deduplication so a transient dropout does not generate a flood. They also need recovery messages and clear operator action when something genuinely fails.
Before mates receive access, the panel needs authenticated roles and a deliberate guest boundary. A viewer should not inherit owner controls merely by being on an allowed network. Power-limit displays likewise need to distinguish a configured GPU cap from actual board or wall consumption.
The repair's outcome is a dashboard with more explicit evidence: configured identity, current observations, unavailable fields and guarded actions. That is the foundation for a lab operator to make decisions without mistaking an attractive status card for a verified machine state.